

Water waste is a costly problem, but not always in the way you might expect. The dramatic leaks that flood a basement or set off alarms are easy to spot. The real danger lies in the slow, silent leaks. The ones that don’t make noise, don’t leave puddles, and often go unnoticed for weeks or even months.
These leaks quietly inflate water bills, damage infrastructure over time, and undermine sustainability goals.
This is where data changes everything.
When buildings have the right tools to monitor and understand their water usage, the silent leaks gain visibility. Instead of reacting to problems, facility managers and sustainability leaders can act early, reduce waste, and improve performance for the future.
In this article, we’ll show how data empowers better water management. You’ll get practical tips based on real-world insights and learn how to use data for water efficiency.
Water management is more than just reducing usage. It’s about protecting infrastructure, optimising operations, cutting unnecessary costs, and achieving long-term sustainability targets.
The challenge? Most buildings are still relying on outdated or manual methods—monthly bills, occasional inspections, or visible signs like damp spots or rising meter readings. These approaches can’t catch what you can’t see.
That’s why data matters.
With continuous water monitoring and analytics, you can:

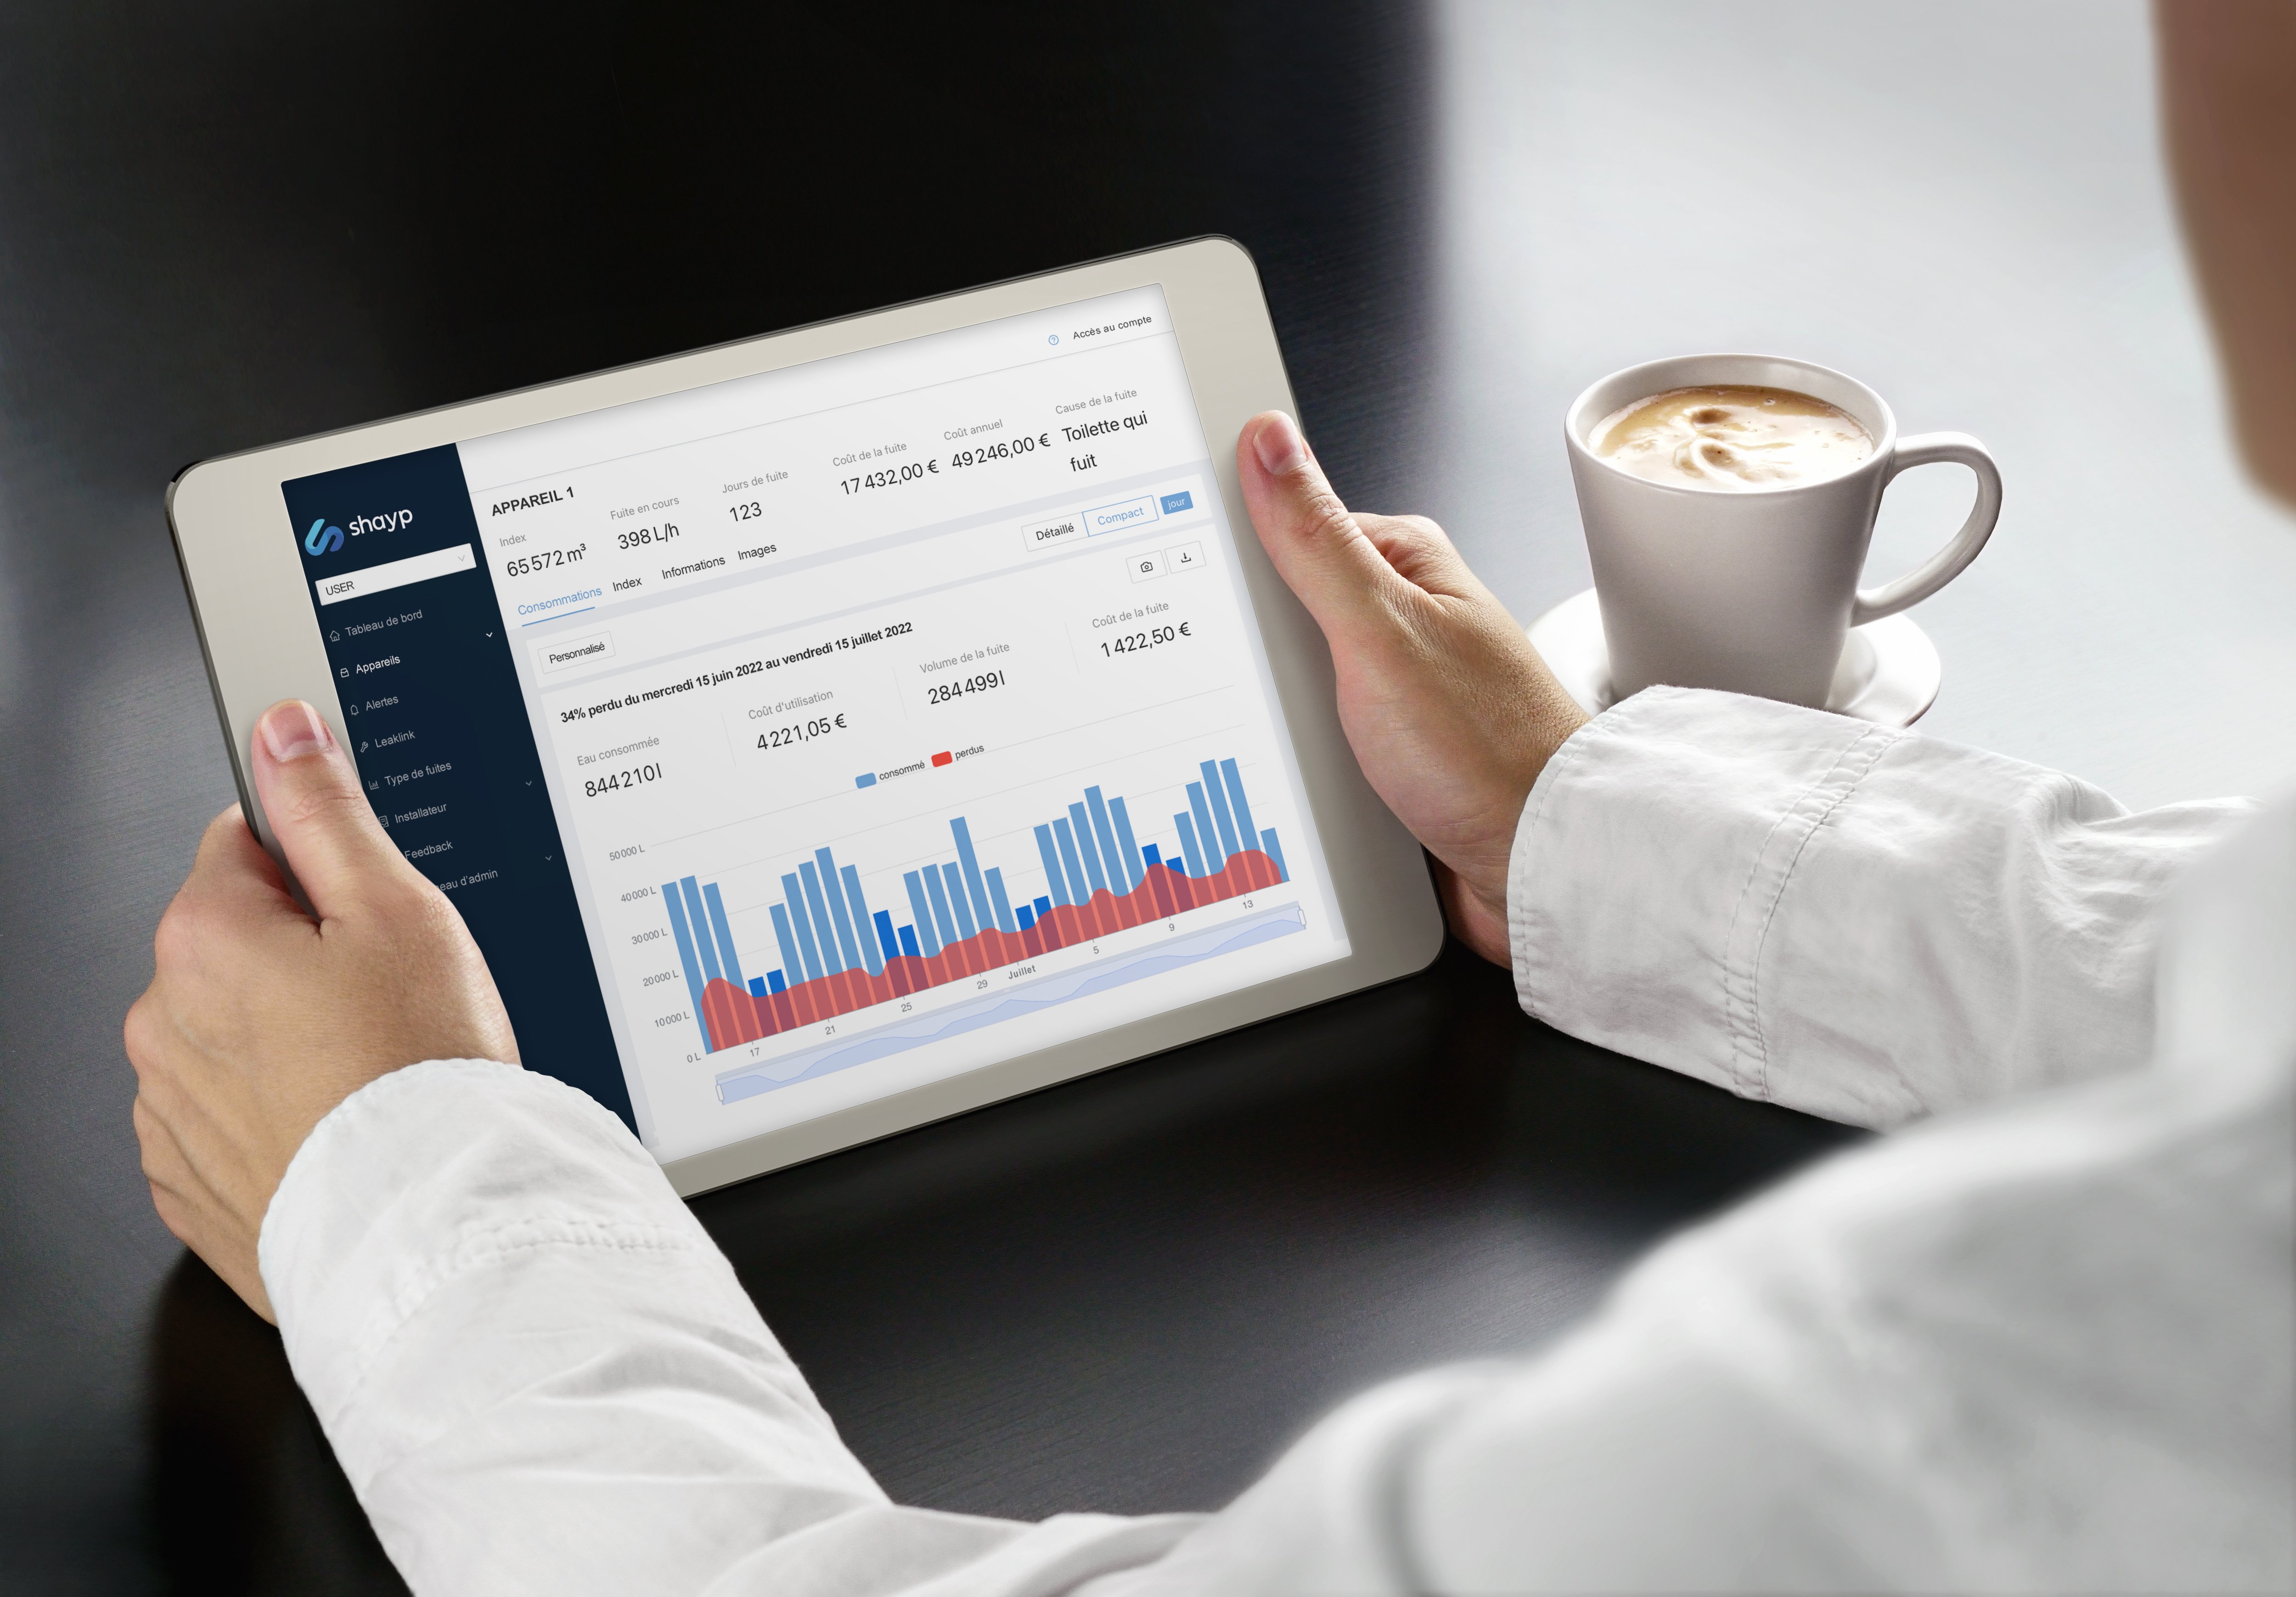
Figure 1. Continuous water monitoring reveals both the scale and impact of hidden inefficiencies. This snapshot from Brussels city shows real-time data on water consumption, leakage, and ongoing issues across multiple buildings.
Let’s break it down into practical steps. Here’s how to make water data work for you.
What data to collect
Start with the basics: you want to know how much water is being used, when, and where.
Useful data points include:

Figure 2. Monthly water data reveals clear patterns in average daily consumption per building, highlighting leaks, usage, and savings. This type of overview helps identify trends, detect anomalies, and measure the impact of water-saving efforts over time.
Collecting data is just the start. The real value comes from turning that data into insights you can act on. Whether you’re managing one building or a whole portfolio, regular analysis helps you detect inefficiencies, prevent leaks, and improve long-term performance.
Start with a baseline
Before anything else, establish what “normal” water use looks like. This gives you a reference point for spotting irregularities.
Look for patterns and anomalies
Once you have your baseline, begin tracking changes and patterns over time. These often reveal the issues you can’t see with the naked eye.
Make insights actionable
At a retirement home monitored by Shayp, a hidden underground leak in the water treatment system was losing 16 m³ per hour. It went unnoticed until continuous monitoring picked up a steady increase in base flow. Thanks to early detection, the issue was fixed within hours, preventing major structural damage and saving approximately €88,000 in costs.
*Source: Shayp’s Leak Detection System, Case Study - Retirement Home Leak.
If you’re working across multiple sites, it’s helpful to create a quick-reference summary with:

Figure 3. Buildings with little maintenance and a large amount of daily visitors are more prone to leakages and water losses. For instance, universities and schools rank the worst on average.
Once you’ve spotted anomalies or patterns that suggest potential issues, such as consistent nighttime flow or sudden spikes in consumption, the next step is to take action. In many cases, this means scheduling an inspection, repairing leaks, or re-evaluating water use routines in cleaning, irrigation, or cooling systems.
Some organisations track leak resolution data and pair it with ongoing savings metrics to better understand what actions lead to the most significant improvements. Over time, maintaining a log of identified issues and corresponding actions helps teams respond faster and more effectively across an entire portfolio.
This operational insight turns water data from a monitoring tool into a decision-making resource. The goal isn’t just to fix individual problems, but to create a system where each solution makes the overall system smarter and more resilient.
Using water data effectively means going beyond quick fixes. It’s about building a routine that turns insights into long-term improvements.
Create repeatable routines
Every time you resolve a leak, log the cause, the fix, and the impact. Use this information to:
Track trends with regular reviews
Set a simple monthly or quarterly review process. Use dashboards to:
Plan next steps
Use what you learn to prioritise:
Embed water into your reporting
Finally, include water metrics in ESG reports, internal KPIs, or performance reviews. Highlighting water savings and leak prevention shows progress and helps justify future investments.
Figure 3. Comparing the average consumption on the installation of the technology and the current month gives you a compelling view of the monthly savings that you’re able to generate.
Using data isn’t just about collecting numbers but about making smarter, faster decisions. When you monitor water consistently, compare performance, and act on what you find, small changes can lead to major savings.
Whether you’re overseeing one building or a portfolio, the key is consistency:

“Looking at comprehensive water monitoring data reveals a critical insight I wish more people understood: the gap between perception and reality in resource consumption is enormous. Most organisations and facility managers believe they have a general sense of their water usage patterns, but detailed monitoring consistently reveals consumption behaviours that contradict intuitive assumptions. What appears to be "normal" usage often masks significant inefficiencies that accumulate over time.
The real power of water data isn't just in identifying problems — it's in showing how water use connects to elements such as occupancy patterns, daily operations, and building age… in ways that aren't immediately obvious. The data provided by our monitoring reports help to transform water management operations from simple reactive maintenance to predictive resource optimization. When organisations can see their consumption patterns as measurable, trackable realities rather than abstract utility costs, they gain the ability to make informed decisions that create substantial environmental and financial impact. The availability of digitalized consumption data, enabling pattern identification and advanced analytics, turns water from an invisible utility into a manageable asset.”— Hernán Blanco, Data Engineer at Shayp, specialising in telematics and data analytics.

By Agnes Aasmaa, Marketing and Communication @ Shayp.